Grafana & Prometheus
Spice can be monitored with Grafana using the Spice Metrics Endpoint and pre-built dashboards available in the Spice repository.
Import Grafana Dashboard
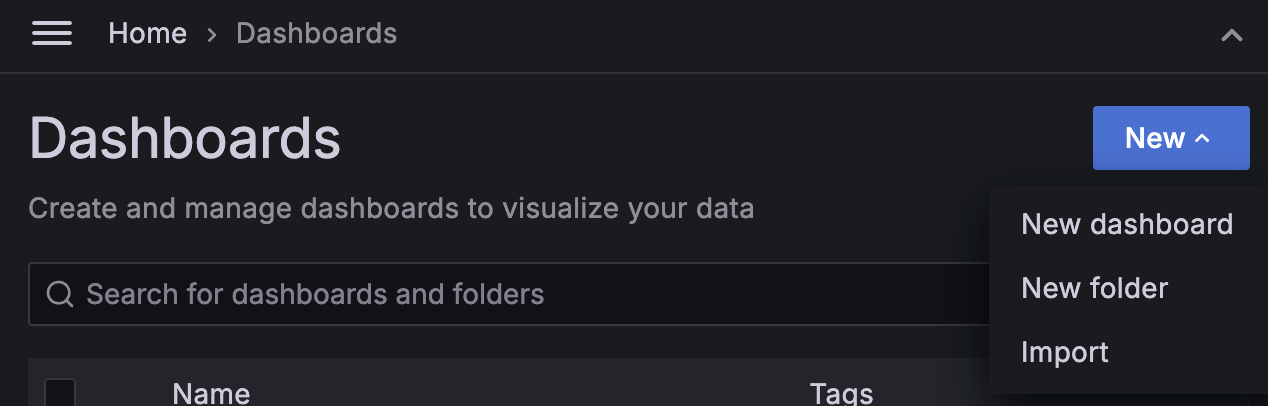
Navigate to the Dashboards section in Grafana and click "New" > "Import".
Copy the dashboard JSON from monitoring/grafana-dashboard.json into the Grafana import box.

Click "Load".
Kubernetes
View the Kubernetes deployment guide for configuring the Prometheus Operator to scrape metrics from the Spice instances in Kubernetes.
Prometheus
Configure a Prometheus instance to scrape metrics from the Spice runtimes.
global:
    scrape_interval: 1s
    scrape_configs:
    - job_name: spiceai
        static_configs:
        - targets: ['127.0.0.1:9090'] # Change to your Spice runtime endpoint + port
Local Quickstart
This tutorial creates and configures Grafana and Prometheus locally to scrape and display metrics from several Spice instances. It assumes:
- Two Spice runtimes,
spiced-mainandspiced-edge, are running on127.0.0.1:9091and127.0.0.1:9092respectively.
-
Create a
compose.yaml:version: '3'
services:
prometheus:
image: prom/prometheus:latest
volumes:
- ./prometheus.yaml:/etc/prometheus/prometheus.yml
ports:
- 9090:9090
network_mode: 'host'
grafana:
image: grafana/grafana:latest
volumes:
- ./.grafana/provisioning:/etc/grafana/provisioning
ports:
- 3000:3000
network_mode: 'host' -
Create a
prometheus.yamltoglobal:
scrape_interval: 1s
scrape_configs:
- job_name: spiced-main
static_configs:
- targets: ['127.0.0.1:9091']
- job_name: spiced-edge
static_configs:
- targets: ['127.0.0.1:9092'] -
Add a prometheus as a source to grafana. Create a
.grafana/provisioning/datasources/prometheus.ymlapiVersion: 1
datasources:
- name: Prometheus
type: prometheus
access: proxy
url: http://localhost:9090
isDefault: true -
Run the Docker Compose
docker-compose up -
Go to
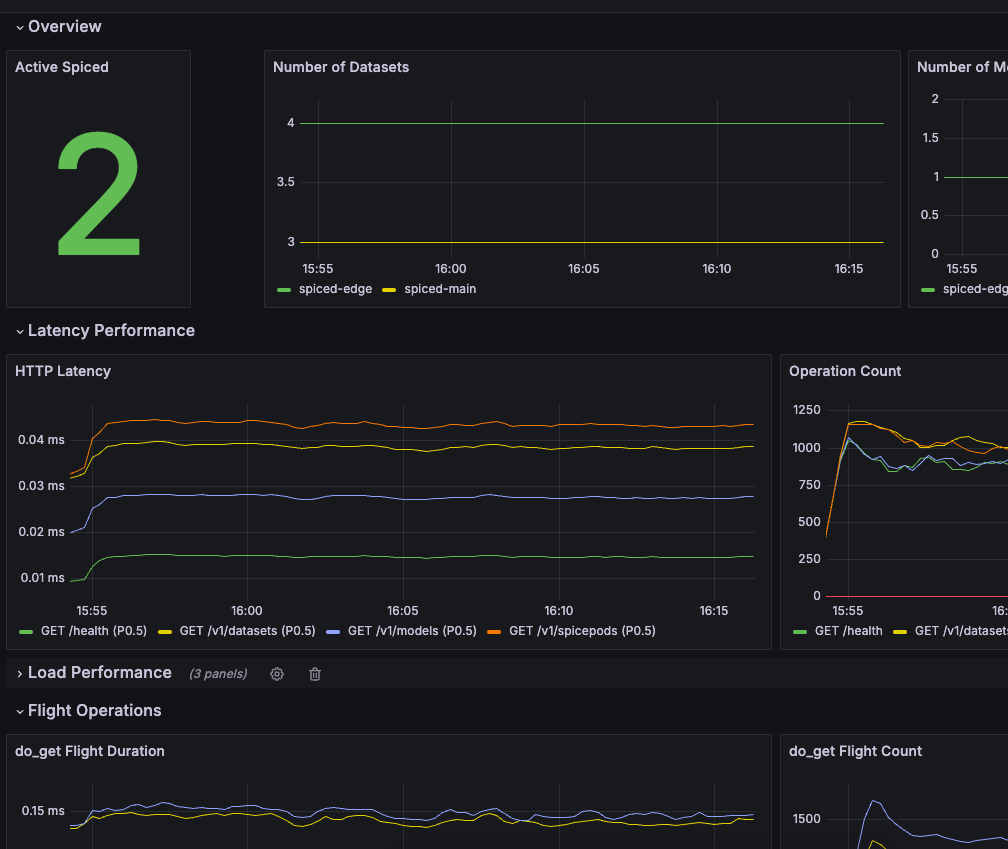
http://localhost:3000/dashboard/importand add the JSON from monitoring/grafana-dashboard.json. -
The dashboard will have data from the Spice runtimes.